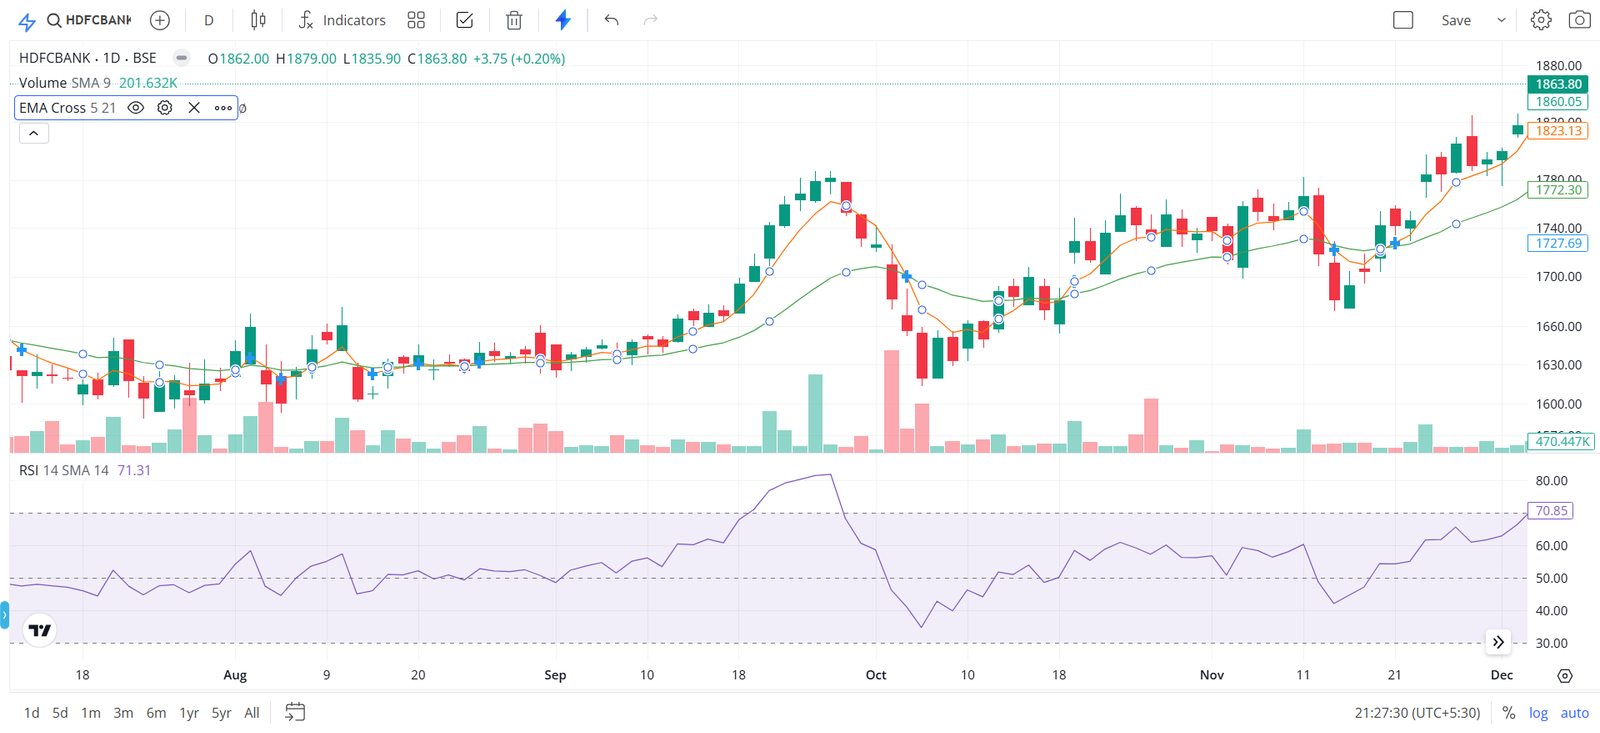
| # | Name of Candle | Diagram | Where It Appears | What to Expect Next | Other Conditions to Check |
|---|---|---|---|---|---|
| 1 | Doji |
    ---
   |   |
    ---
|
Indecision in trend | Possible reversal or continuation | Confirm with volume and surrounding candles |
| 2 | Hammer |
      |
     ---
    |   |
|
Bottom of a downtrend | Bullish reversal | Followed by bullish candles; strong volume |
| 3 | Hanging Man |
      |
     ---
    |   |
|
Top of an uptrend | Bearish reversal | Confirmation with subsequent bearish candles |
| 4 | Bullish Engulfing |
    |   |
    |████|
|
Bottom of a downtrend | Bullish continuation or reversal | Increased volume; follows a bearish candle |
| 5 | Bearish Engulfing |
    |████|
    |   |
|
Top of an uptrend | Bearish continuation or reversal | Increased volume; follows a bullish candle |
| 6 | Morning Star |
    * (small)
    * (large bearish)
    * (large bullish)
|
Bottom of a downtrend | Bullish reversal | Three distinct candles; volume confirmation |
| 7 | Evening Star |
    * (small)
    * (large bullish)
    * (large bearish)
|
Top of an uptrend | Bearish reversal | Three distinct candles; volume confirmation |
| 8 | Shooting Star |
      |
     ---
    |   |
|
Top of an uptrend | Bearish reversal | Long upper wick; confirmation with bearish candles |
| 9 | Harami Bullish |
    |████|
    |  █ |
|
Bottom of a downtrend | Bullish reversal | Small bullish candle within bearish body; volume decrease |
| 10 | Harami Bearish |
    |  █ |
    |████|
|
Top of an uptrend | Bearish reversal | Small bearish candle within bullish body; volume decrease |
| 11 | Piercing Line |
    |██|
    |  █ |
|
Bottom of a downtrend | Bullish reversal | Second candle closes above midpoint of first bearish candle |
| 12 | Dark Cloud Cover |
    |  █ |
    |██|
|
Top of an uptrend | Bearish reversal | Second candle closes below midpoint of first bullish candle |
| 13 | Spinning Top |
    ---
   |   |
    ---
|
Indecision in trend | Possible reversal or continuation | Small body with long wicks; check surrounding candles |
| 14 | Marubozu |
    |████|
    |   |
    |████|
    |   |
|
Continuation of trend | Strong continuation | No wicks or very small wicks; high volume |
| 15 | Three White Soldiers |
    |██|
    |██|
    |██|
|
Bottom of a downtrend | Strong bullish continuation | Each candle closes higher with increasing volume |
| 16 | Three Black Crows |
    |██|
    |██|
    |██|
|
Top of an uptrend | Strong bearish continuation | Each candle closes lower with increasing volume |
| 17 | Tweezer Top |
    |██|
    |██|
|
Top of an uptrend | Bearish reversal | Matching highs; confirmation with bearish follow-up |
| 18 | Tweezer Bottom |
    |██|
    |██|
|
Bottom of a downtrend | Bullish reversal | Matching lows; confirmation with bullish follow-up |
| 19 | Belt Hold Bullish |
    |████|
    |   |
|
Bottom of a downtrend | Bullish continuation or reversal | Long bullish body; opens at low of the session |
| 20 | Belt Hold Bearish |
    |████|
    |   |
|
Top of an uptrend | Bearish continuation or reversal | Long bearish body; opens at high of the session |
| 21 | Inverted Hammer |
    ---
      |
      |
    |   |
|
Bottom of a downtrend | Bullish reversal | Small body with long upper wick; confirmation with bullish candle |
| 22 | Bullish Kicker |
    |████|
    |████|
|
Trend continuation or reversal | Strong bullish move | Gap up between two candles; first bearish, second bullish |
| 23 | Bearish Kicker |
    |████|
    |████|
|
Trend continuation or reversal | Strong bearish move | Gap down between two candles; first bullish, second bearish |
| 24 | Three Inside Up |
    |   |
    |██|
    |██|
    |██|
|
Bottom of a downtrend | Bullish reversal | Three bullish candles with each closing higher than previous |
| 25 | Three Inside Down |
    |██|
    |██|
    |██|
    |   |
|
Top of an uptrend | Bearish reversal | Three bearish candles with each closing lower than previous |
Notes on Reading the Diagrams:
- | | represents the body of the candle.
- — represents the wicks (shadows) of the candle.
- ████ indicates a filled (bearish) candle.
- █ indicates a hollow (bullish) candle.
- Patterns are simplified and may vary in appearance based on charting tools and timeframes.
Additional Tips:
- Volume Confirmation: Higher trading volume during the formation of a pattern often strengthens its validity.
- Trend Context: Patterns are more reliable when they appear at significant trend reversals or continuation points.
- Multiple Indicators: Combine candlestick patterns with other technical indicators (e.g., moving averages, RSI) for better accuracy.
- Timeframe Consideration: Patterns can behave differently across various timeframes (e.g., daily vs. hourly charts).
Understanding and correctly identifying these candlestick patterns can significantly enhance trading strategies by providing insights into potential market movements. However, it’s essential to practice and combine them with other analysis tools to increase reliability.
